CorEvitas theme branding
02_corevitas_colors.RmdGet started
To get started, let’s load the package into our working session:
If you have not downloaded it yet from our private github repo, please see the Readme on the package home page.
First, set your CorEvitas ggplot2 theme.
Standard colors
You can specify one or more of the following options to manually pull the individual colors:
- orange
- deep red
- dark gray
- black
- white
- yellow
- mustard
- red
- salmon
- rust
- maroon
- tint gray
- light gray
- medium gray
- dark gray
Retrieving HEX codes for colors
To retrieve the correct HEX color code for the CorEvitas colors, just pass the color name(s) to corevitas_cols():
corevitas_cols(c("red", "rust", "orange"))
      red      rust    orange
"#E03214" "#BD3E1D" "#FC7408"
Example below:
ggplot(mtcars, aes(hp, mpg)) +
    geom_point(color = corevitas_cols("red"),
               size = 4, alpha = .8)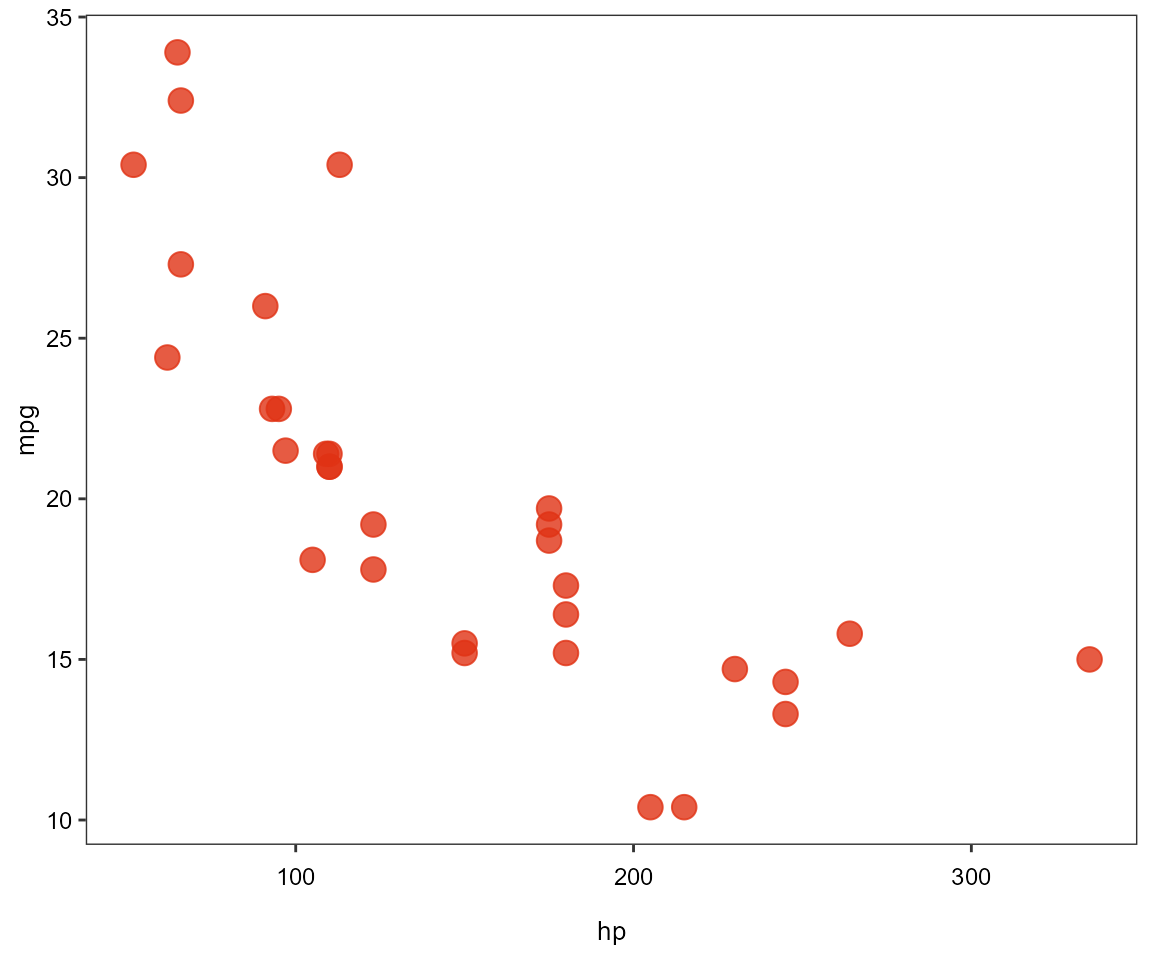
Discrete color palettes
You can specify one or more of the following options to manually pull the color palettes for discrete data:
- primary (default)
- secondary
- neutrals
Retrieving list of HEX codes based on CorEvitas palette
To retrieve the correct list of HEX color codes based on discrete palette name, just pass the palette name to corevitas_pals() and specify the number of colors you need from the palette scheme:
number_of_colors_needed = 10
corevitas_pal(palette = "primary")(number_of_colors_needed)
 [1] "#FC7408" "#E75714" "#D23A20" "#BE1E2D" "#8F252F" "#612C31" "#333333"
 [8] "#222222" "#111111" "#000000"
Using discrete CorEvitas palettes with ggplot
Primary
ggplot(iris, aes(Sepal.Width, Sepal.Length, color = Species)) +
    geom_point(size = 4) +
    scale_color_corevitas()
Secondary
ggplot(iris, aes(Sepal.Width, Sepal.Length, color = Species)) +
    geom_point(size = 4) +
    scale_color_corevitas(palette = "secondary")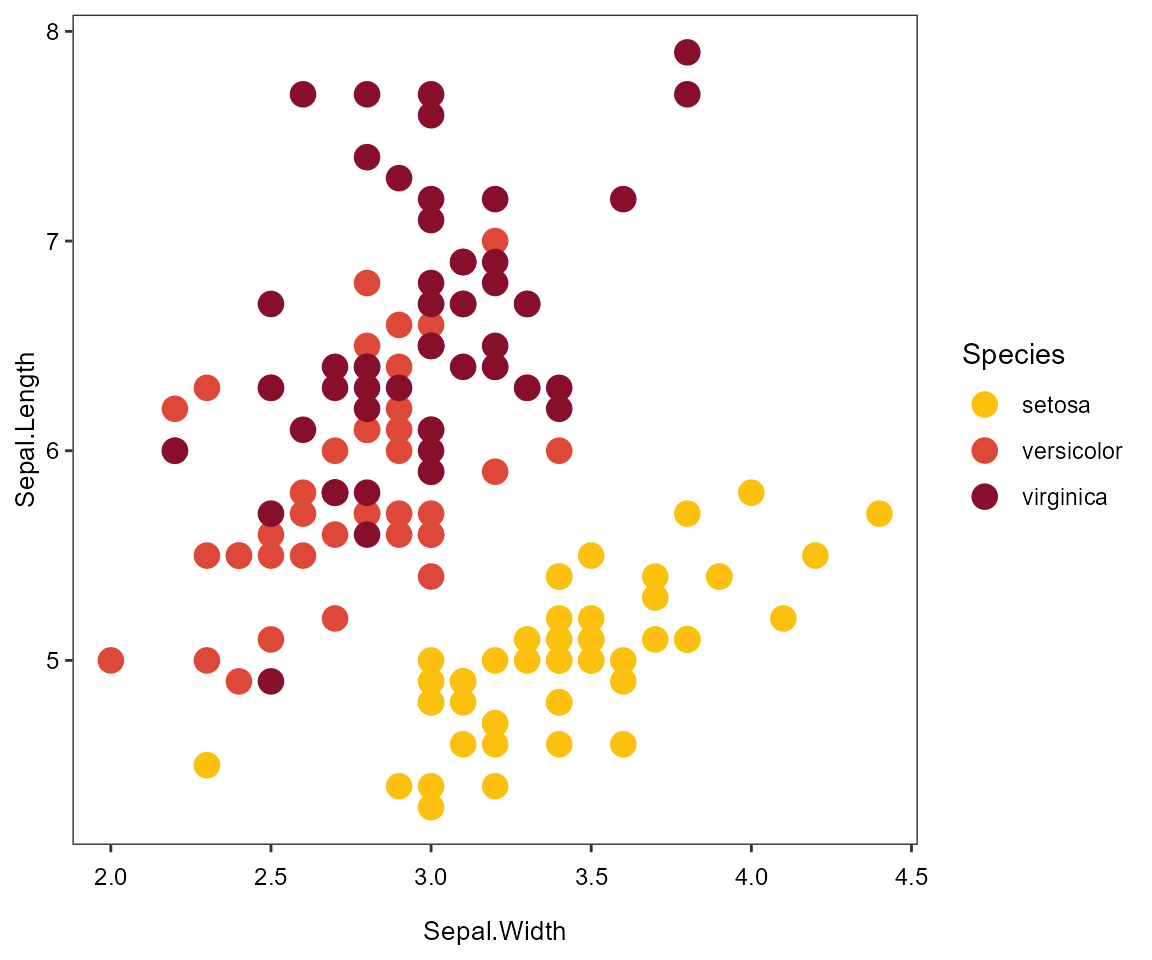
Neutral
ggplot(iris, aes(Sepal.Width, Sepal.Length, color = Species)) +
    geom_point(size = 4) +
    scale_color_corevitas(palette = "neutrals")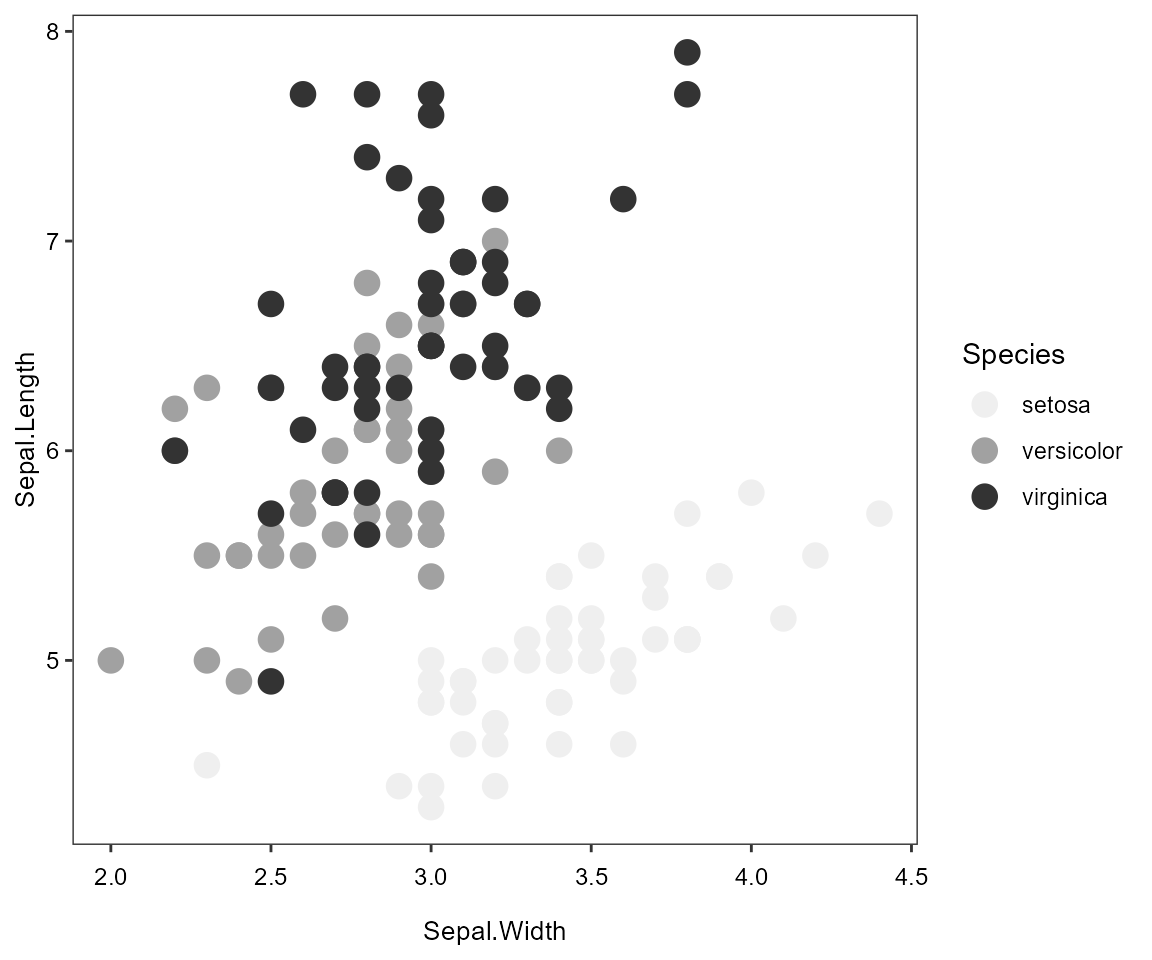
Using continuous CorEvitas palettes with ggplot
You can specify one or more of the following options to manually pull the color palettes for continuous data:
- principal gradient
- gradient #2
- gradient #3
- any of the discrete color palettes previously mentioned
Principal gradient
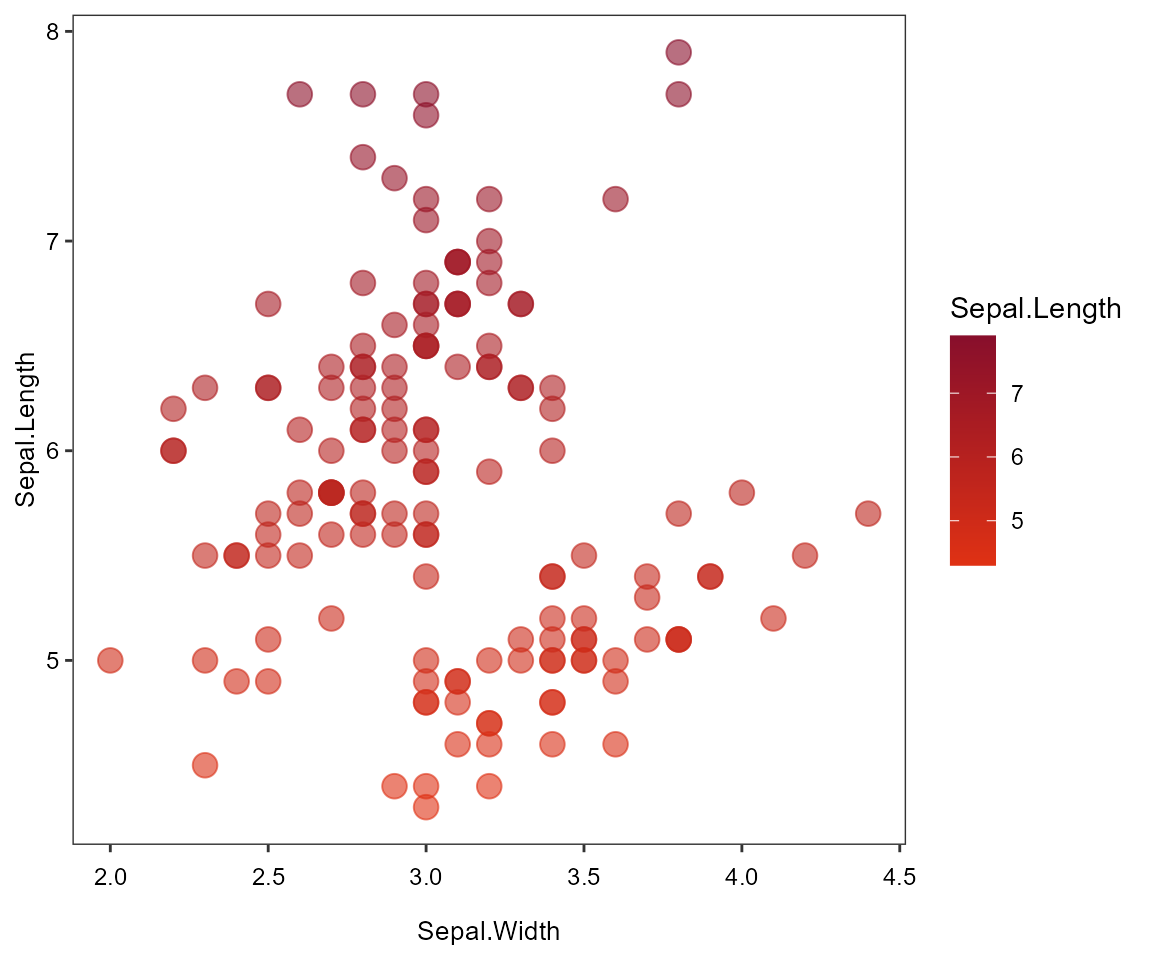
ggplot(iris, aes(Sepal.Width, Sepal.Length, color = Sepal.Length)) +
    geom_point(size = 4, alpha = .6) +
    scale_color_corevitas(discrete = FALSE, palette = "principal gradient")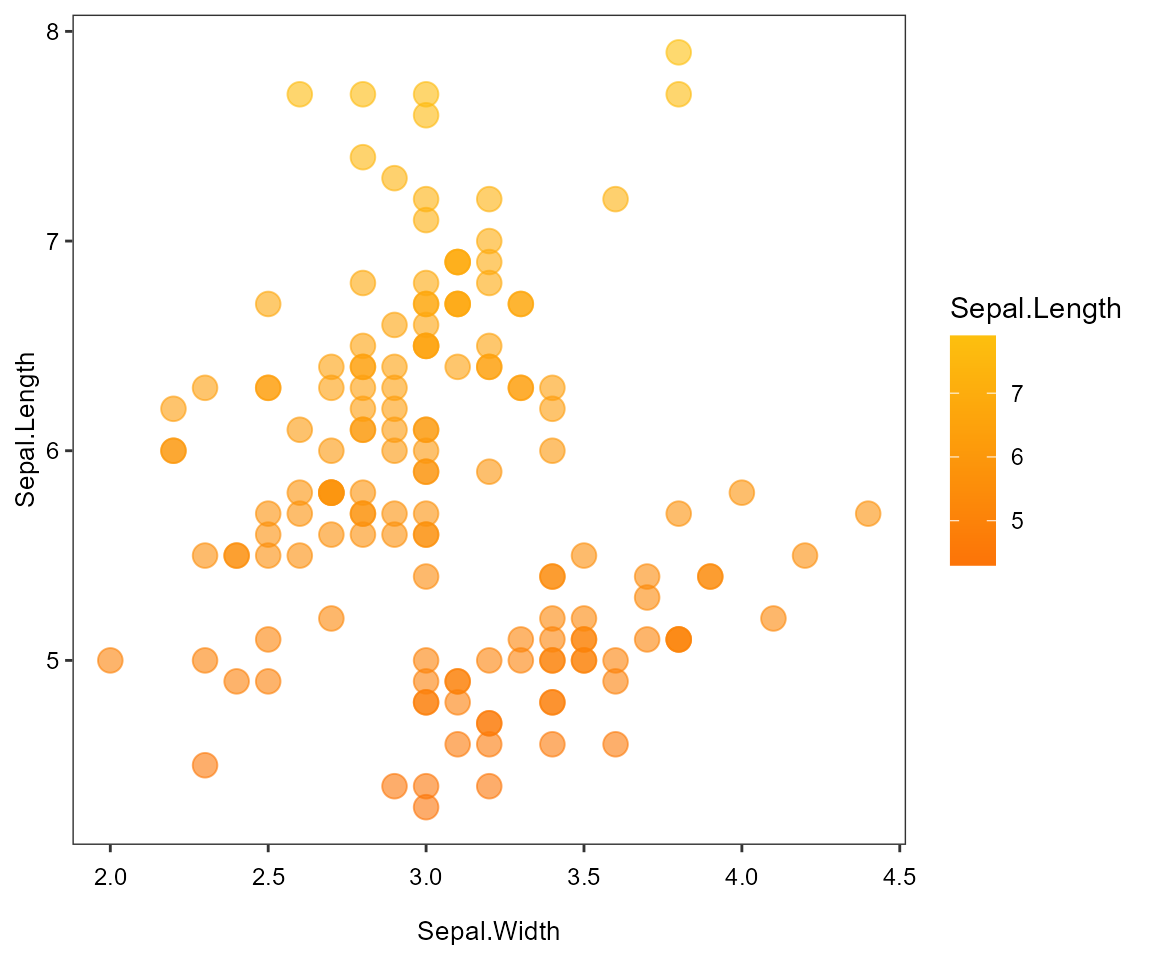
Gradient #2
ggplot(iris, aes(Sepal.Width, Sepal.Length, color = Sepal.Length)) +
    geom_point(size = 4, alpha = .6) +
    scale_color_corevitas(discrete = FALSE, palette = "gradient #2")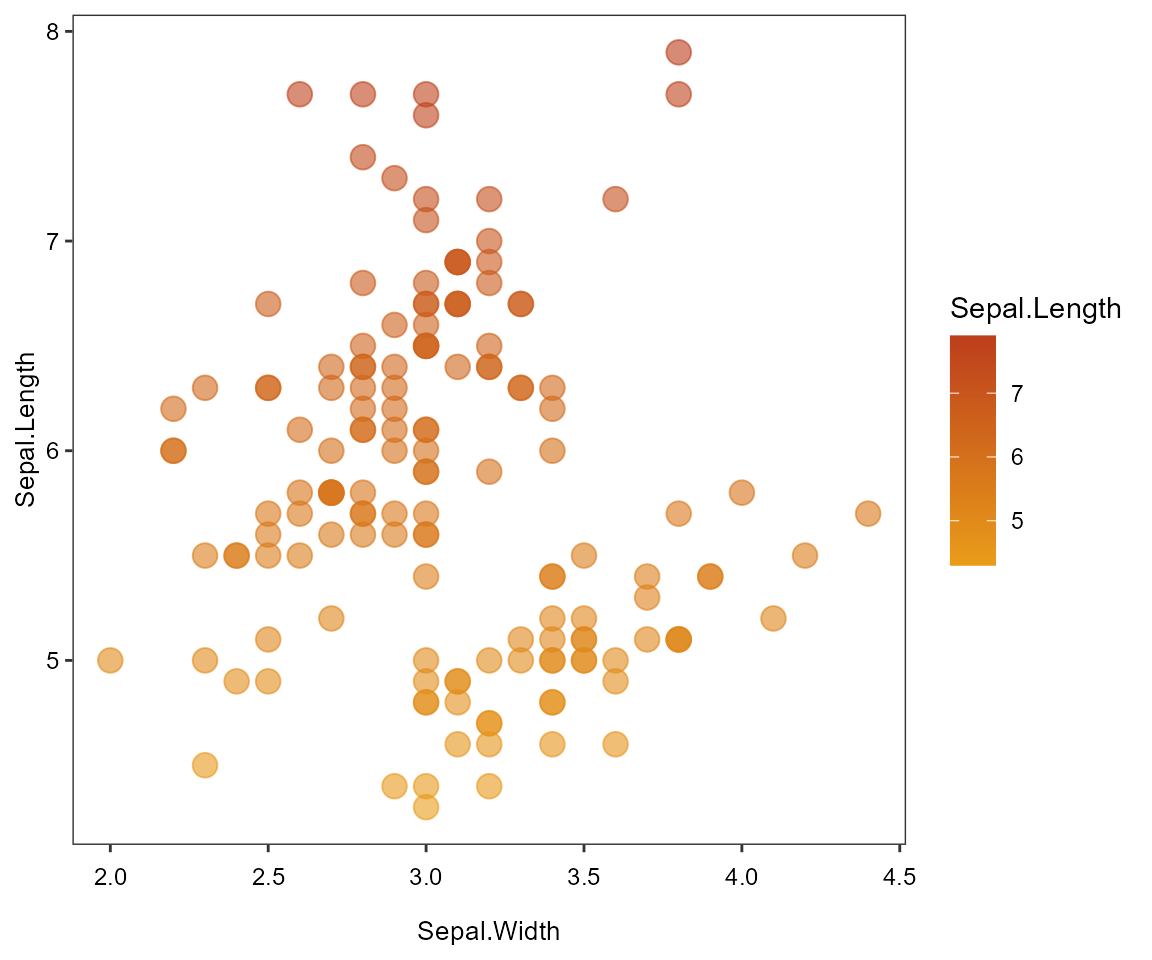
Gradient #3
ggplot(iris, aes(Sepal.Width, Sepal.Length, color = Sepal.Length)) +
    geom_point(size = 4, alpha = .6) +
    scale_color_corevitas(discrete = FALSE, palette = "gradient #3")